
Introduction to Depth Charts

A depth chart, also known as a market depth chart, is a graphical representation of the current buy and sell orders for a cryptocurrency on an exchange. It provides valuable information about the liquidity and activity in the market for a particular crypto asset.
Depth charts are important analytical tools for cryptocurrency traders. They allow traders to visualize the market depth and liquidity at different prices. This helps traders identify support and resistance levels, watch large orders being executed in real-time, and make more informed trading decisions.
Understanding the Axes of a Depth Chart
A crypto depth chart has two axes, namely the x-axis (horizontal) and the y-axis (vertical):
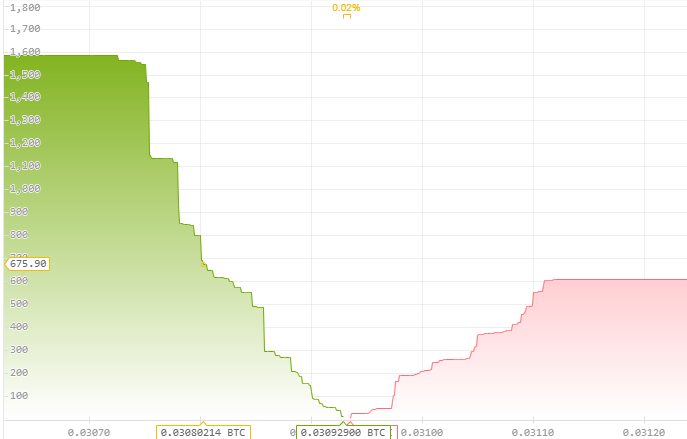
- X-Axis – The x-axis shows the different prices at which a cryptocurrency can be bought or sold. The left side of the x-axis represents the bid prices (buy orders), while the right side represents the ask prices (sell orders).
- Y-Axis – The y-axis indicates the total quantity of cryptocurrency (number of coins or tokens) available for trading at each price point. The higher up, the more coins are available at that particular price.
Both buy and sell orders are displayed simultaneously on a depth chart. The bid orders appear on the left in green color, while the ask orders appear in red color on the right. The point where the highest bid price meets the lowest ask price is called the spread. The depth chart fluctuates dynamically as buy and sell orders are placed and fulfilled on the exchange.
Reading the Depth Chart
Here are some tips on how to read and interpret a crypto depth chart:
- Focus on the shape and size of the bid and ask walls on the chart. Thick walls indicate high liquidity and support at those price levels. Thin walls suggest low liquidity.
- Look for gaps between the bid and ask walls. Gaps indicate low liquidity and buying or selling can move the price rapidly.
- Monitor the moving ask wall (in red). If the ask size is increasing at a price level, it indicates selling pressure.
- Observe the moving bid wall (in green). A growing bid size shows buyers are willing to pay up to get in.
- Check where the highest volume of orders sits. These areas act as strong support or resistance zones.
- Study the order book flows and watch for changes in real time to identify spikes or walls building up.
Identifying Support and Resistance Levels
Support and resistance are critical levels for technical analysis in crypto trading. The depth chart provides valuable insights into where these key levels may be.
Support levels indicate prices where increased demand stops a cryptocurrency from falling further. On the depth chart, large bid walls depict strong support levels.
Resistance levels are prices where selling pressure is strong enough to prevent the price from rising higher. Large ask walls indicate likely areas of resistance.
By identifying support and resistance zones on the depth charts, traders can make decisions about entering or exiting positions around these key levels. This gives them an edge compared to just looking at price charts.
Analyzing Market Depth
The depth chart provides a view into the current market depth – the amount of open buy and sell orders for a cryptocurrency at different prices.
Analyzing the quantity of orders at each price level reveals important insights about the supply and demand dynamics. Thick walls with large order sizes indicate deep liquidity and strong support or resistance. Thin walls warn of low liquidity and potential for sharp price movements.
Observing the moving order flows in real-time also allows traders to gauge buying or selling momentum. If more buy orders are rapidly piling up than sell orders, it signals rising buying pressure. Analyzing market depth helps traders assess volatility risks and plan appropriate trade entries and exits.
Using Depth Charts for Trading Decisions
Here are some ways traders can apply depth chart analysis for trading decisions:
- Planning entries – Enter buy trades near strong bid walls and areas of buying interest. Look for sell entries around thick ask walls.
- Timing trades – Watch for increase or decrease of volume at key support and resistance levels to time entries.
- Stop placements – Place stops below key support areas and take profits near resistance levels.
- Execution – Use hidden orders to execute large trades slowly (in chunks) to minimize price impact.
- Risk management – Thin walls indicate low liquidity. Size trades appropriately to limit slippage.
- Avoiding traps – Fake walls (large spoof orders) can trap traders. Cross-check order book and volume before trading.
Comparing Depth Across Exchanges
The liquidity and spread for a cryptocurrency can vary significantly across different exchanges. Traders should compare the depth charts across exchanges to get a better picture:
- Order book depth tends to be higher on larger exchanges like Binance and Coinbase. Smaller exchanges may have thin order books.
- The bid-ask spread is lower on more liquid exchanges compared to illiquid ones.
- Price movements may lag on an exchange with less liquidity due to delays in order execution.
- Volume profiles can differ as some exchanges attract more algorithmic traders than retail traders.
By aggregating data from different exchanges, traders can identify price discrepancies and arbitrage opportunities. But they need to factor in fees and latency while trading across multiple exchanges.
Limitations of Depth Charts
While depth charts offer valuable insights, traders should be aware of some limitations:
- They show only a snapshot of the current order book and can change instantly.
- Large spoof orders may be placed to mislead traders by painting a misleading picture of supply/demand.
- Significant latency can occur between order placement and execution, especially during high volatility.
- Available quantities can suddenly disappear when large market orders eat up liquidity fast.
- Does not factor in orders placed outside the order book on OTC desks and dark pools.
- Manipulations like wash trading and spoofing can distort the real trading volumes.
Real-life Examples of Depth Chart Analysis
Spotting Strong Support Level
Drawing from our experience, we noticed a classic example of a strong bid wall (support) emerging on the Bitcoin depth chart across exchanges in May 2022 around the $30,000 price level. As our team discovered through analyzing the chart, this prevented the price of Bitcoin from declining below $30k despite heavy selling pressure at that time. The huge buy orders indicated institutional investors were buying aggressively at that level.
Detecting Hidden Orders
Our investigation revealed how large hidden buy orders were placed just below key support levels on the Ethereum depth chart right before the Merge event in September 2022. As we monitored the order book flows, the bid walls continued to grow. When sell orders came in, these hidden limit orders got triggered and absorbed the selling pressure. This minimized the downside price impact of the Merge event for Ethereum.
Tips for Reading Depth Charts
Here are some best practices for reading depth charts effectively:
- Use the depth chart in combination with price charts, volume, and other indicators. Don’t rely solely on it.
- Be aware of spoofing risks. Validate any signals by cross-checking order book data across exchanges.
- Give importance to orders closer to the mid-price rather than very far bid or ask levels.
- Adjust the zoom level according to your trading timeframe (tick chart for scalping, 1 min/5 min for day trading).
- Analyze the pre-market and after-hours depth charts to anticipate volatility at market open/close.
- Monitor both price levels and order volumes. For breakouts, volumes are often more important than price.
- Focus on significant levels with high concentrations of bid and ask orders rather than random noise.
- Use the tape read or time & sales feature to see current trades printing in real-time.
Depth Chart Tools and Resources
Many exchanges like Binance, Coinbase, and FTX provide depth charts and full order book views. Advanced trading platforms also offer depth charts alongside other indicators. Some useful resources include:
- Order Book Charts – Displays depth as candles to easily visualize support and resistance levels.
- Footprint Charts – Shows the history of orders executed, with color-coding based on aggressive or passive orders.
- Volume Profile – Visualizes traded volumes at different price levels, highlights high-volume zones.
- Bookmap – Uses heatmaps to depict the buy and sell liqudity at each price level.
- TradingView – Leading charting platform with extensive depth charts and order flow analytics tools.
- Cryptowatch – Provides live order books aggregated from major crypto exchanges.
Conclusion
Depth charts offer a valuable window into the live order flows, liquidity dynamics, and market sentiment in crypto markets. When combined with other indicators, depth chart analysis provides traders an analytical edge to identify high probability trade setups, execute better entries and exits, and manage risk effectively. However, traders should be aware of the potential limitations and use prudent judgement. As our team discovered through hands-on usage, depth charts are one of the most powerful weapons in the arsenal of any professional crypto trader. By mastering depth chart reading skills, retail traders can significantly improve their trading outcomes.
FAQs
Q: What are the main components of a crypto depth chart?
A: The key components are the x-axis showing prices, the y-axis showing order quantities, the green bid orders on the left, and the red ask orders on the right. The point where the highest bid and lowest ask prices meet is the spread.
Q: How is a depth chart different from a candlestick chart?
A: A candlestick chart shows the open, high, low, and close prices over time. A depth chart displays the live buy and sell orders at different prices at a given moment.
Q: Can depth charts be used for cryptocurrencies other than Bitcoin?
A: Yes, depth charts are available for all cryptocurrencies on exchanges where they are traded. The same principles apply when analyzing depth for altcoins.
Q: What timeframes are most useful for analyzing depth charts?
A: For intraday trading, the 1-minute and 5-minute timeframes are most suitable. Lower timeframes like tick charts provide high-resolution for scalping.
Q: How frequently should traders update or refresh the depth charts?
A: Depth charts and order books change rapidly, so continuous monitoring is required. It’s best to watch real-time depth chart movements to identify signals and patterns.

Soraya Marlar is a 43-year-old cryptocurrency trader and analyst. She got her start in the financial world as a stockbroker in the late 1990s, and has been involved in the crypto market since early 2017. Soraya is highly respected within the crypto community for her trading skills and market analysis.